Introducing Safety Command Center: Agentic AI for Your Safety Data
Key Takeaways
- Ask, don't build: Query your safety data in plain language instead of assembling spreadsheets — no dashboard configuration, no SQL
- Investigations, not just charts: Purpose-built analysis for event spikes, event drops, and recurring problem patterns
- Share-ready output: Formatted PowerPoint, Word, and PDF reports generated in minutes, with charts and pagination
- Runs on its own: Schedule recurring briefs and watchdogs that surface trends before you think to look
- Agentic, and shows its work: The agent selects and runs multiple analytics tools per question, then tells you which ones it consulted
- Honest by design: Exact counts only, stated confidence levels, and explicit caveats when evidence is thin
Every EHS leader we work with has the same problem. The data exists — thousands of detections across dozens of cameras and several sites — but turning it into an answer takes a person, a spreadsheet, and most of a Thursday. By the time the deck is ready for the leadership review, the question has moved on.
Safety Command Center, available from September 12, 2026, removes that gap. Ask a question the way you'd ask a colleague. Get an answer grounded in your own detection history, with a report you can forward without reformatting.
Ask your safety data a question
Safety Command Center is a chat interface over your own data, powered by frontier language models — Claude and GPT — reasoning over results returned by Visionify's analytics engine.
The distinction matters. The model does not guess at numbers. It decides which analyses to run, runs them against your detection history, and then writes up what came back. Questions our customers ask on day one:
- "There seems to be a big spike in the last few weeks. What happened?"
- "Which areas got worse this quarter, and which improved?"
- "Did helmet compliance actually improve in MINE after we ran toolbox talks?"
- "Why did detections drop on Line 3 — is that real, or is a camera offline?"
- "What are our three most common violations, and where are they concentrated?"
You don't build a dashboard to ask any of these. You type the question.
It investigates — it doesn't just plot
A chart tells you that something changed. An investigation tells you what changed, where, why, and what to do about it. Safety Command Center ships with analysis paths built for the questions EHS teams actually escalate.
Spike analysis
When volume jumps, the first job is separating a real behavioural change from a configuration change. Safety Command Center compares equal periods, locates the exact date of a level shift, decomposes the change by event type, area, and camera, and cross-references your configuration history to see whether a rule was edited.
Event-drop analysis
A fall in detections looks like good news and is often the opposite — a camera offline, a stream re-pointed, a rule disabled. The same machinery runs in reverse, so a drop gets interrogated rather than celebrated.
Common-problem analysis
Which violations recur, in which zones, on which shifts, and which of them are genuinely distinct events versus the same person detected repeatedly. That last distinction is the one most safety reporting gets wrong.
A real investigation, start to finish
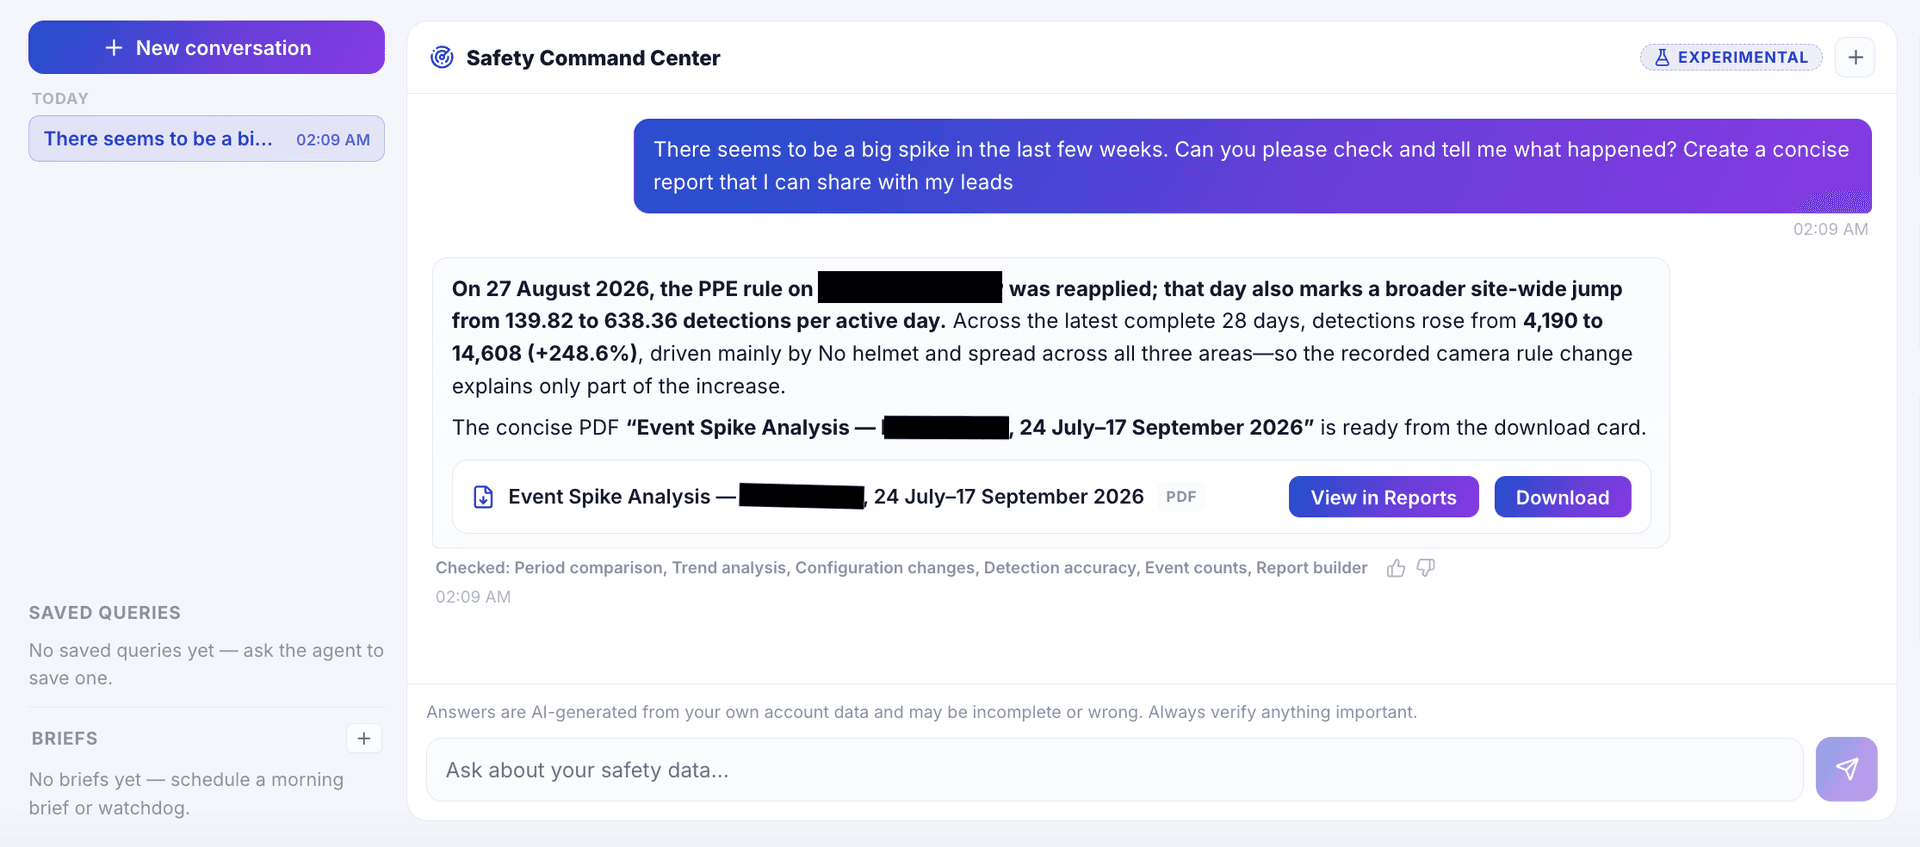
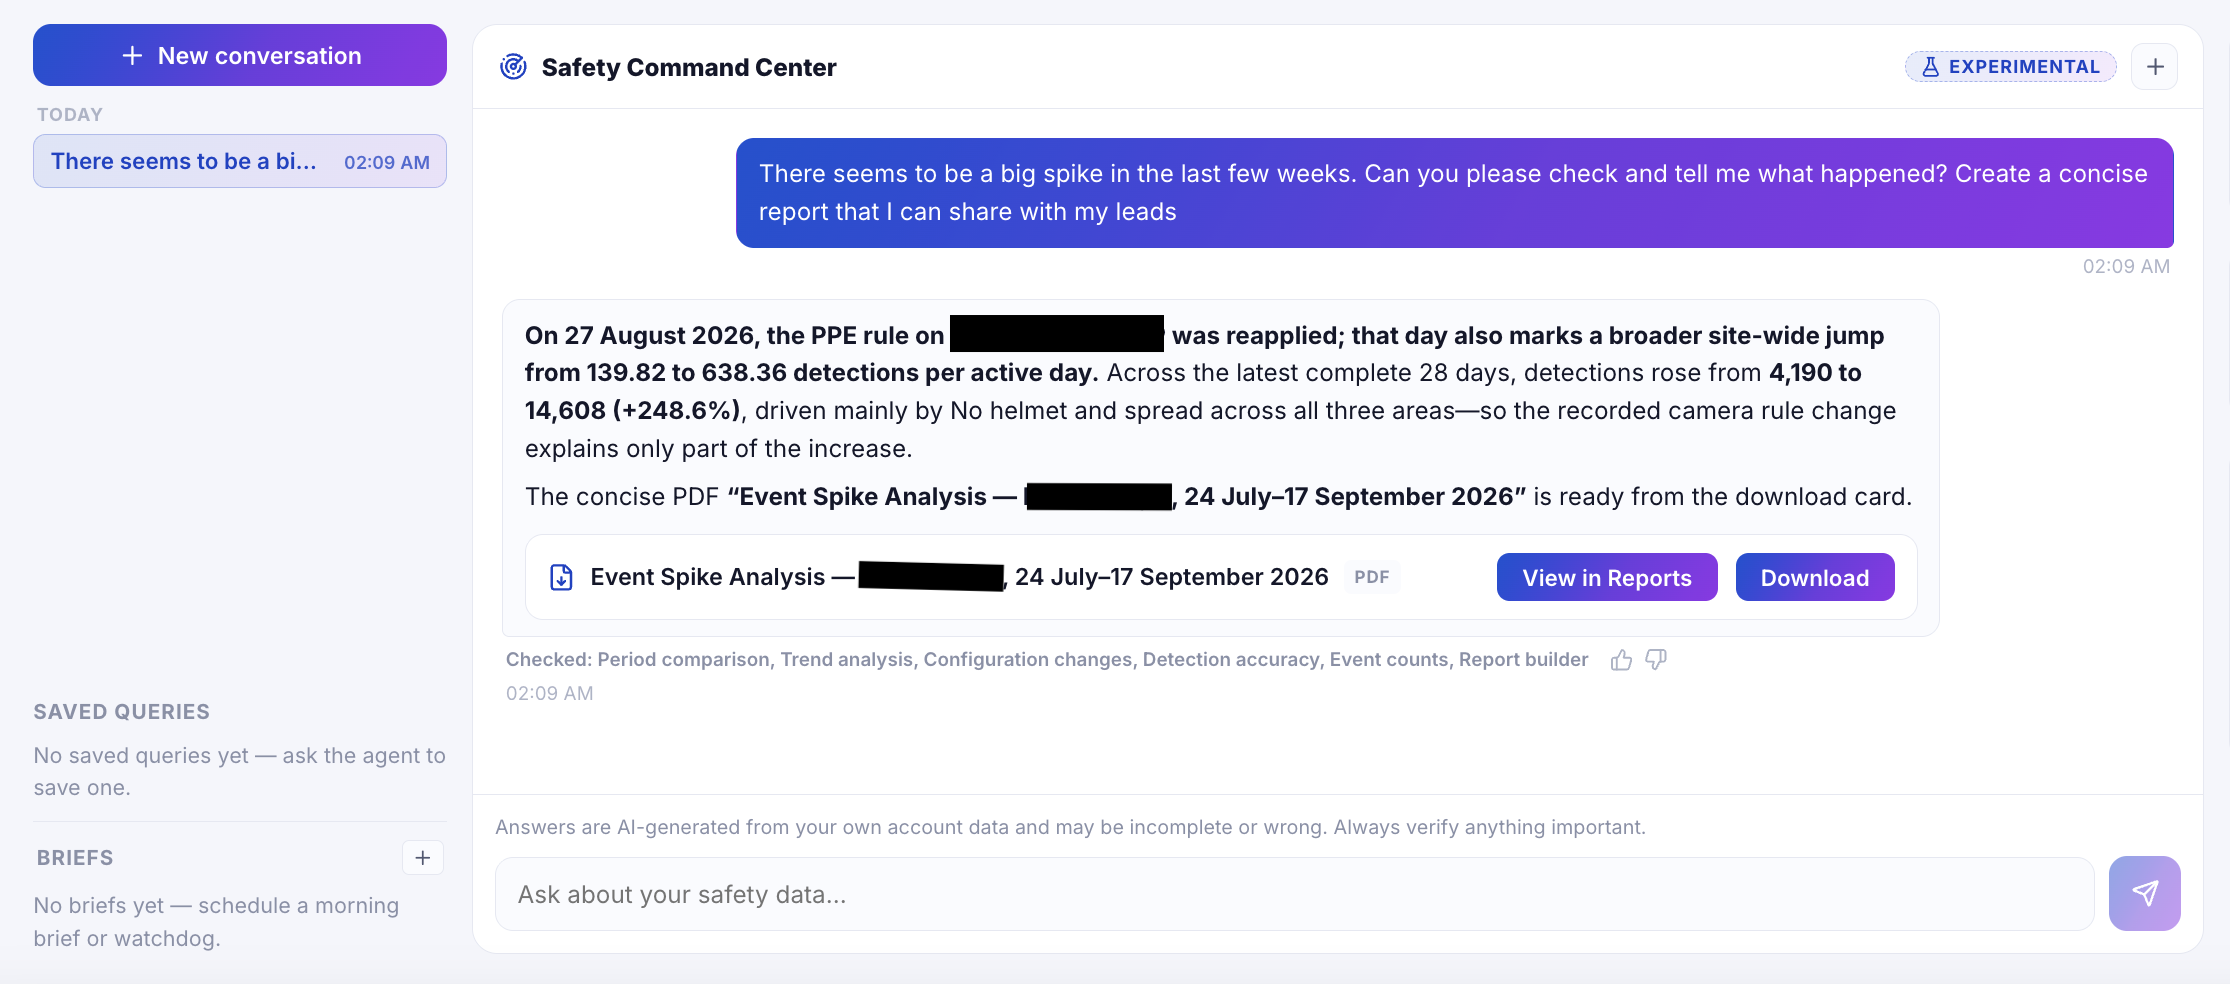
Here is an actual spike investigation, anonymised. The prompt was one sentence: "There seems to be a big spike in the last few weeks. Can you please check and tell me what happened? Create a concise report that I can share with my leads."
Download the sample report — Event Spike Analysis (PDF, 4 pages)
The agent consulted six analytics tools — period comparison, trend analysis, configuration changes, detection accuracy, event counts, and the report builder — and produced a four-page PDF. What it found:
It located the change precisely. Detections rose from 4,190 to 14,608 across equal 28-day windows, +248.6%. More usefully, it identified the change as a one-day step on 27 August — from 139.82 to 638.36 detections per active day, a 4.57× level shift — rather than gradual drift. Those are different problems with different causes.
It attributed the increase. PPE Compliance accounted for 10,371 of the 10,418 additional detections, with No helmet alone up 7,439. Every area rose: MINE +5,011, ACID +3,342, FERTILIZER +2,065. It ranked the twelve largest movers out of 48 cameras.
It separated repeats from distinct events. Alongside 14,608 raw detections it reported 10,839 grouped incidents — repeat detections of the same situation within five minutes counted once. Without that column, you over-react to a number inflated by one person standing under one camera.
And then it declined to overclaim. A ppe-compliance rule on one camera had been deleted and reapplied on 27 August — the same date as the step. The convenient conclusion was right there. Instead the report says the rule change explains part of that one camera but not the simultaneous growth across multiple cameras and all three areas, and assigns the wider explanation medium confidence. It also notes that human review coverage was too low to draw a firm conclusion about detection quality, and recommends that Visionify investigate whether something changed in the detection layer.
That last part is the feature. A tool that always finds a tidy answer is a tool you eventually stop trusting. This one told the customer that the obvious explanation was insufficient, flagged its own uncertainty, and assigned a follow-up action to us.
Reports your leadership can actually read
Every answer can become a document — PowerPoint for the safety committee, Word for a report you want to edit, PDF for the audit file. Formatted, charted, paginated, headed with your site and period, and footed with your company name.
Each report carries a method note stating what was counted and how, an About this data section confirming that every figure is an exact count or a calculation on exact counts, and a reference ID so a number in a board pack can be traced back to the analysis that produced it.
Recommendations come prioritised, with an owner and a confidence level attached — including, where appropriate, actions owned by Visionify rather than by you.
Set it running and let it come to you
The best safety analysis is the kind that arrives before you thought to ask.
- Scheduled briefs — a Monday trend summary, a monthly EHS report, a quarterly board pack, generated and delivered automatically
- Watchdogs — standing checks that notify you when a metric crosses a threshold you define, so a developing pattern surfaces in days instead of at quarter end
- Saved queries — the questions you ask every month, kept and re-runnable against the current period
What "agentic" means here
The word gets used loosely, so here is the specific behaviour.
Given a question, the agent plans which analyses are needed, runs several in sequence, uses what it finds to decide what to check next — the configuration-history lookup in the example above happened because the step-change analysis surfaced a suspicious date — and assembles the results into a written finding with a document attached. Then it reports which tools it consulted, so the reasoning path is inspectable rather than opaque.
This is the same capability that already runs through the Visionify platform: agents that monitor streams, group related detections into incidents, route alerts by severity and shift, and escalate when a pattern develops. Safety Command Center is that capability pointed at your historical data and given a conversational interface.
What EHS teams are using it for
Beyond investigations, the use cases that have come up most in early access:
Reporting and governance
- Monthly and quarterly EHS reporting — the recurring safety section, generated rather than assembled
- Board and executive packs with leading-indicator trends in presentation form
- Evidence packets for insurance renewals and broker reviews
Audit and compliance
- Pre-audit preparation — demonstrating that a control operated across a period, not just on inspection day
- Regulatory and client safety questionnaires answered from actual detection history
- Contractor versus employee compliance comparisons on shared sites
Operational improvement
- Intervention validation — did compliance measurably improve after the training, the signage, or the rule change?
- Shift, supervisor, and crew comparisons to target coaching where it will matter
- Near-miss clustering to find the zones generating repeat exposure before an injury occurs
- Multi-site benchmarking, so a plant manager can see where their site sits in the portfolio
Platform hygiene
- Alert-fatigue tuning — finding rules that generate high repeat volume and re-baselining them
- Coverage verification — catching cameras and rules that quietly stopped producing events
- Detection-quality review, using human-review coverage to decide where model tuning is worth the effort
Availability
Safety Command Center is available to Visionify customers as of September 12, 2026, marked experimental while we expand analysis coverage and gather feedback. Answers are AI-generated from your own account data and, as the interface says, should be verified before you act on anything material.
To enable it for your account, contact your account team or schedule a demo and we'll walk through it against your data.
Frequently Asked Questions
Find answers to common questions about this topic
Want to learn more?
Discover how our Vision AI safety solutions can transform your workplace safety.
Schedule a DemoSchedule a Meeting
Book a personalized demo with our product specialists to see how our AI safety solutions can work for your business.
Choose a convenient time
Select from available slots in your timezone
30-minute consultation
Brief but comprehensive overview of our solutions
Meet our product experts
Get answers to your specific questions
Subscribe to our newsletter
Get the latest safety insights and updates delivered to your inbox.